One of the common themes in my work is the use of data visualizations to measure and improve operations. This might apply to the performance of a website, the throughput of a back end delivery system, or any other business function.
Key to this work is bridging the gap between technical and business metrics. The response time of a website, measured in detail, will result in a complex technical view. The rate at which that website is fielding customer orders, on the other hand, will immediately resonate and be useful across a wide spectrum of business functions.
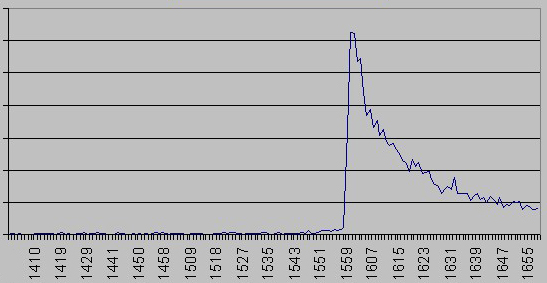
As an example, sending out hundreds of thousands of emails to an engaged audience, and offering a special price deal that begins at a specific time, with limited quantities of product on offer, will result in a flash crowd. When properly handled, the order rate graph will look like this.